Same house. Same thermostat setting. Same two people running the same loads of laundry. The electric bill is higher than it was a year ago anyway, and last year's was higher than the year before.
So are you running more stuff? Probably not. Nationally, households bought a little less electricity this June than last June, about 0.2 percent less, going by the federal Energy Information Administration's numbers. Your usage likely held steady. It's the price of each kilowatt-hour that moved.
18.34 cents per kilowatt-hour. That was the average U.S. residential price in June 2026, per the EIA. A year earlier it was 17.47 cents. That's up 5.0 percent, and Maryland, Virginia, New York and Pennsylvania each saw more than 10 percent.
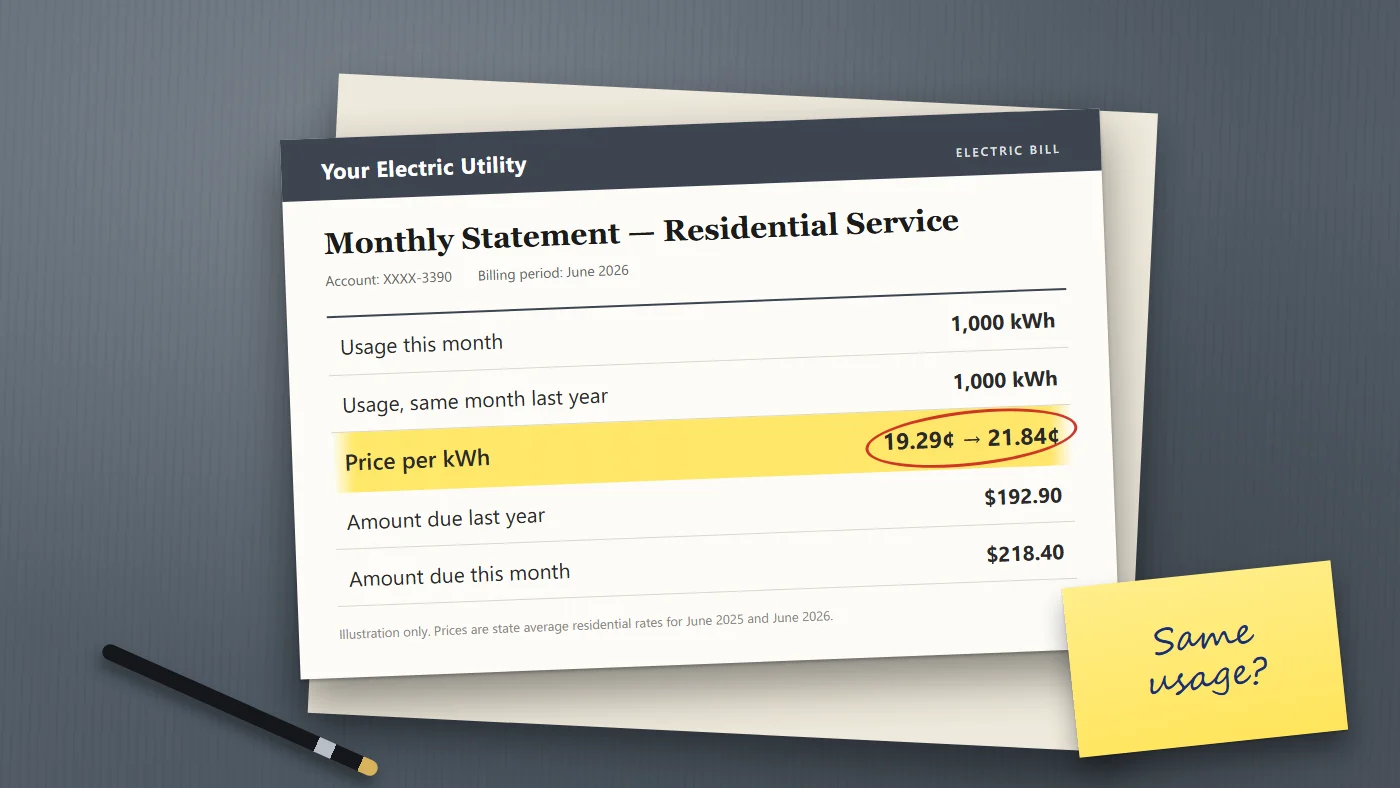
What does less than a penny do to a real bill? Picture a home that buys the national average, about 899 kilowatt-hours a month. On that house, the 0.87-cent gap comes to roughly $8 a month. Annoying, not ruinous. But few homes sit right on the average. In Maryland, a house using 1,000 kilowatt-hours paid about $25 more in June than it had a year before. Keep that up for twelve months and you're out around $300.
Hawaii had it worst. Prices there jumped nearly 29 percent. A couple of states went the other way, too: in Florida and Connecticut, prices actually fell.
Don't count on a break soon. For 2026 as a whole, the EIA expects the average residential price to land at 18.2 cents, which would be 5.2 percent above 2025. And next year? Its outlook, from September 2026, has 18.6 cents. Those are forecasts, of course, and the agency redoes them every month.
That leaves three questions. What's pushing the price up, and which part of your own bill grew? And with the federal tax credits for solar and efficiency upgrades gone, which fixes still earn their keep?
What's pushing the price up
There isn't one cause. Several are stacking on top of each other.
Demand is growing again. For years, U.S. electricity use barely grew. Not anymore. The EIA now forecasts record consumption in 2026 and 2027, rising nearly 2 percent a year, and it points to data centers and manufacturing. Keep an eye on the data centers. Back in 2023 they used about 4.4 percent of the country's electricity. By 2028 their share could be anywhere from 6.7 to 12 percent, says a Department of Energy report prepared by Lawrence Berkeley National Laboratory.
More demand raises the price of having enough power plants. Live somewhere between New Jersey and Illinois? Your grid may be run by PJM, which covers 13 states and the District of Columbia. Each year it holds an auction to lock in enough generating capacity for when it's needed. For the year that began in June 2026, that price cleared at $329.17 per megawatt-day. Why so steep? Forecast peak demand had jumped by more than 5,400 megawatts, according to PJM, driven largely by data center expansion, electrification and economic growth. Its own estimate of what that does to households: 1.5 to 5 percent on some customers' bills.
That cost gets spread across everyone on the system, households included. It's one reason several of this year's steepest increases, in Maryland, Virginia, Pennsylvania and Ohio, happened inside PJM's territory.
The grid itself is being rebuilt. Utilities are replacing old poles, wires and substations and hardening lines against storms and wildfires. State regulators approve those costs, and they show up in the delivery portion of your bill, often as separate riders. You won't see a line that says new poles, but you're paying for them.
Fuel still matters. Natural gas is the largest source of U.S. power generation. When gas prices rise, the supply part of your bill follows within months.
How much more, state by state
These are EIA average residential prices for June 2026 against June 2025, with the dollar change for a home using 1,000 kilowatt-hours that month. Monthly state figures are preliminary and get revised.
| State | June 2025 | June 2026 | Change | On 1,000 kWh |
|---|
| Maryland | 19.29¢ | 21.84¢ | +13.2% | +$25.50 |
| Virginia | 15.23¢ | 17.22¢ | +13.1% | +$19.90 |
| New York | 26.55¢ | 29.49¢ | +11.1% | +$29.40 |
| Pennsylvania | 19.69¢ | 21.73¢ | +10.4% | +$20.40 |
| Ohio | 17.50¢ | 19.19¢ | +9.7% | +$16.90 |
| Illinois | 18.29¢ | 19.89¢ | +8.7% | +$16.00 |
| Texas | 15.26¢ | 15.94¢ | +4.5% | +$6.80 |
| California | 33.59¢ | 34.74¢ | +3.4% | +$11.50 |
| Florida | 15.35¢ | 15.10¢ | -1.6% | -$2.50 |
| U.S. average | 17.47¢ | 18.34¢ | +5.0% | +$8.70 |
A state average hides a lot. Your own increase depends on your utility, your rate plan and how much you use in the hottest and coldest months, and two neighbors on different utilities can see very different numbers.
It also hides where the increase landed on the bill. Some of it's in the supply price. Some is in delivery. And some sits in a fixed monthly charge and a string of small riders with names like "grid modernization" or "storm recovery," billed no matter how carefully you use power. The bill itself rarely explains any of them.
You can't do a thing about a capacity auction. You can find out which part of your own bill grew, and that tells you which fix is worth the trouble. That's the next section, and all it takes is two bills and a calculator.